Breadcrumb
Gender Pay Gap Report 2025
PAY GAP
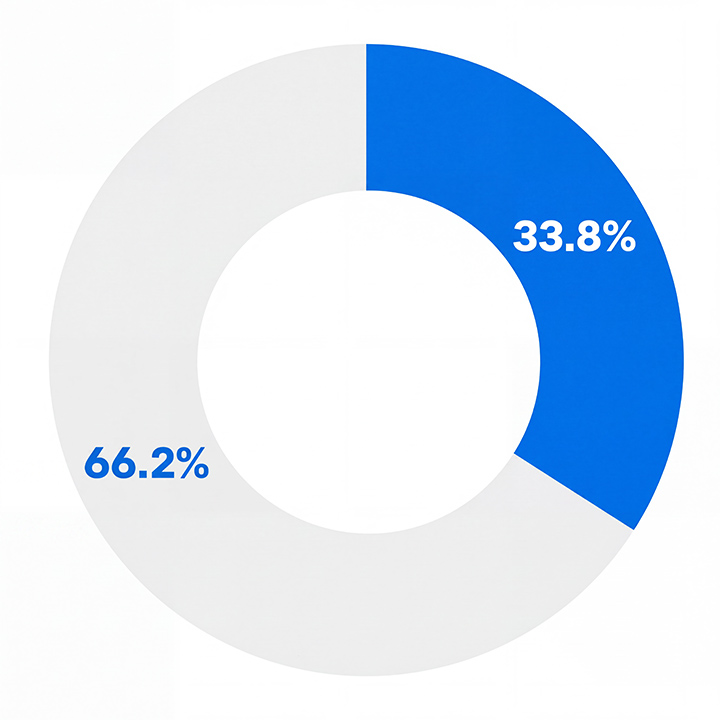
 % MALES
  % FEMALES
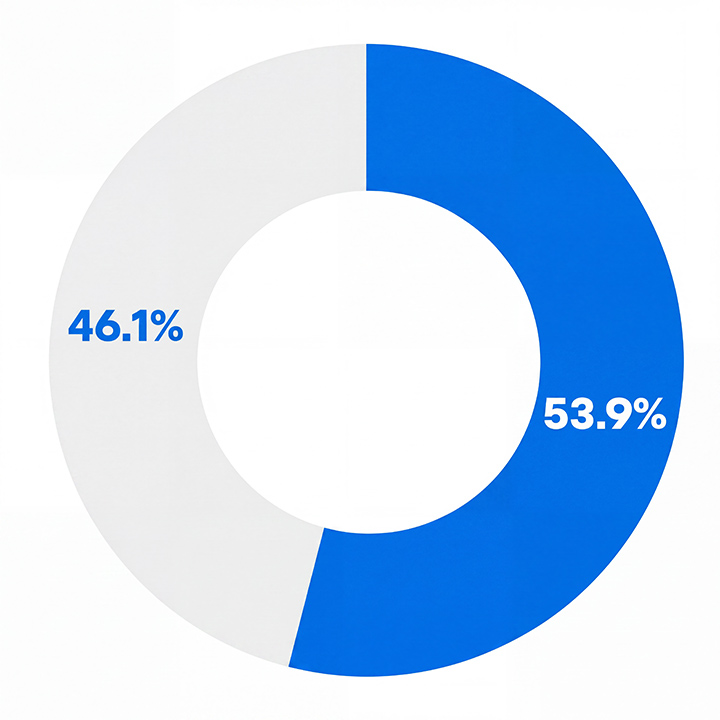
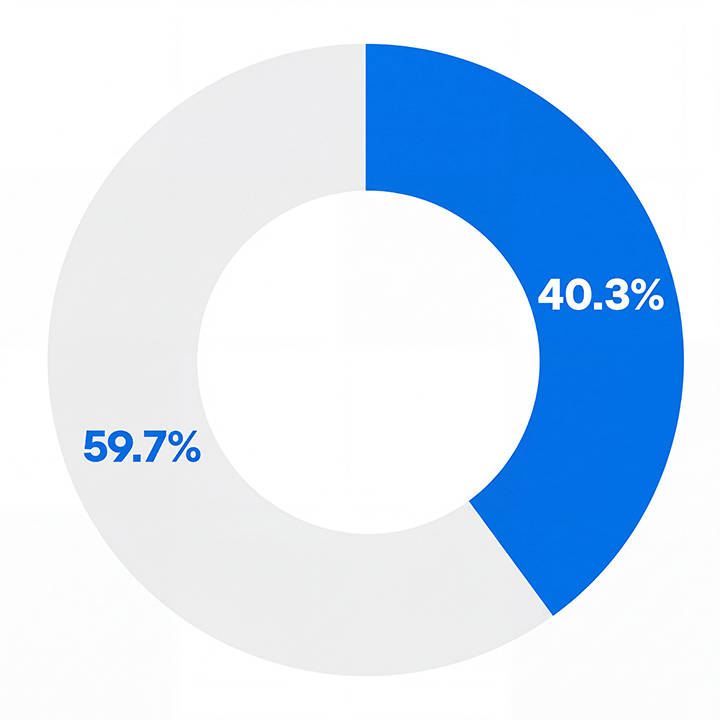
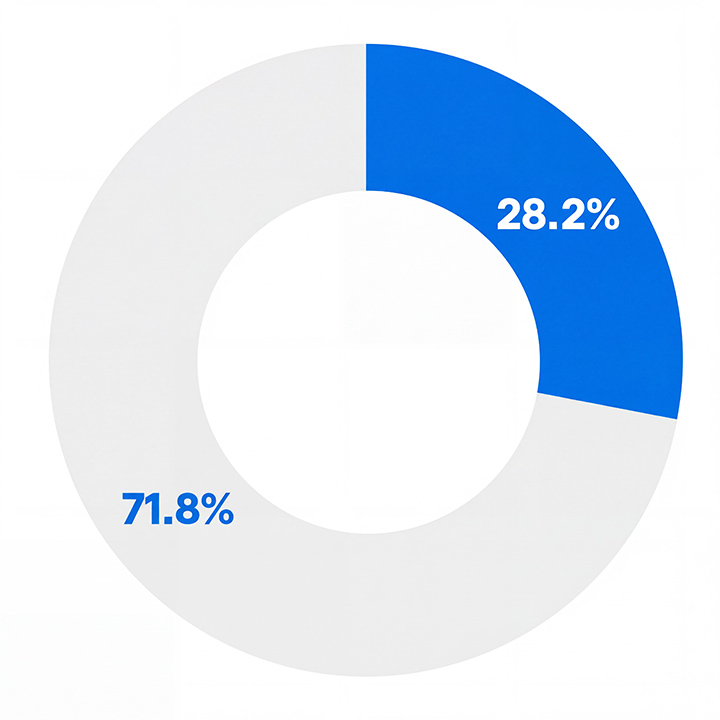
The above charts show the gender distribution across four equally sized pay quartiles.
This shows that MandM has two thirds of male colleagues in the upper and upper middle quartiles, a slightly higher percentage of male colleagues in the lower middle quartile and a more even split of male and female colleagues in the lower quartile.
Understanding our data
At MandM Direct we are confident that men and women are paid equally while working in equivalent roles.
Our data shows that we currently have a higher percentage of our male population based in all roles across the business but more so in senior roles in the business.
Our actions
Although we believe that our Gender Pay Gap shows that we pay equally and we are confident that we pay male and female colleagues equally for equivalent roles, we have taken steps to ensure we are monitoring this regularly and in more depth to ensure that these results are consistent across all areas.
We will continue to monitor this regularly and are confident that the published information is accurate.
This statement is signed by the Chairman of MandM Direct, Mike Tomkins